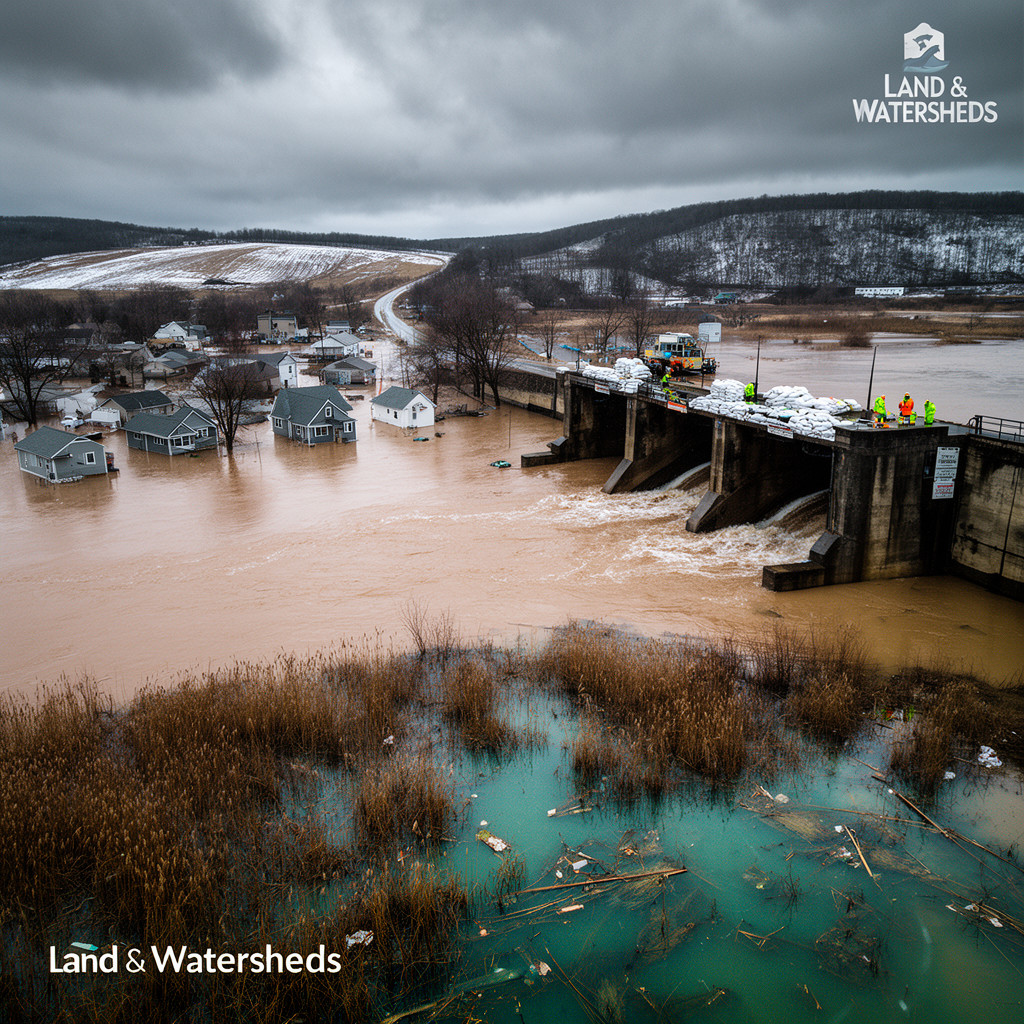
A 100-year flood doesn't happen once a century. It has a 1% chance of occurring every single year, and over a 30-year mortgage, your odds of experiencing one are closer to 1 in 4. The river doesn't care about your label, and the historical data used for flood maps likely underestimates current climate conditions.
A 100-year flood is not an event that occurs once every hundred years. It refers to a flood with a 1% annual exceedance probability, meaning there's a 1% chance it will happen in any given year. The recurrence interval is a statistical artifact, not a schedule the river follows.
The technical term hydrologists use is Annual Exceedance Probability (AEP). A 1% AEP event is what engineers call a 100-year flood. A 2% AEP event is a 50-year flood. The return period is simply the mathematical inverse of the annual probability: 1 divided by 0.01 equals 100.
The river doesn't track time. It has no memory of when it last flooded. Every year, independently, there is a 1% chance that the 100-year event will occur. The probability is stationary, resetting to exactly 1% every single year regardless of what happened the year before.
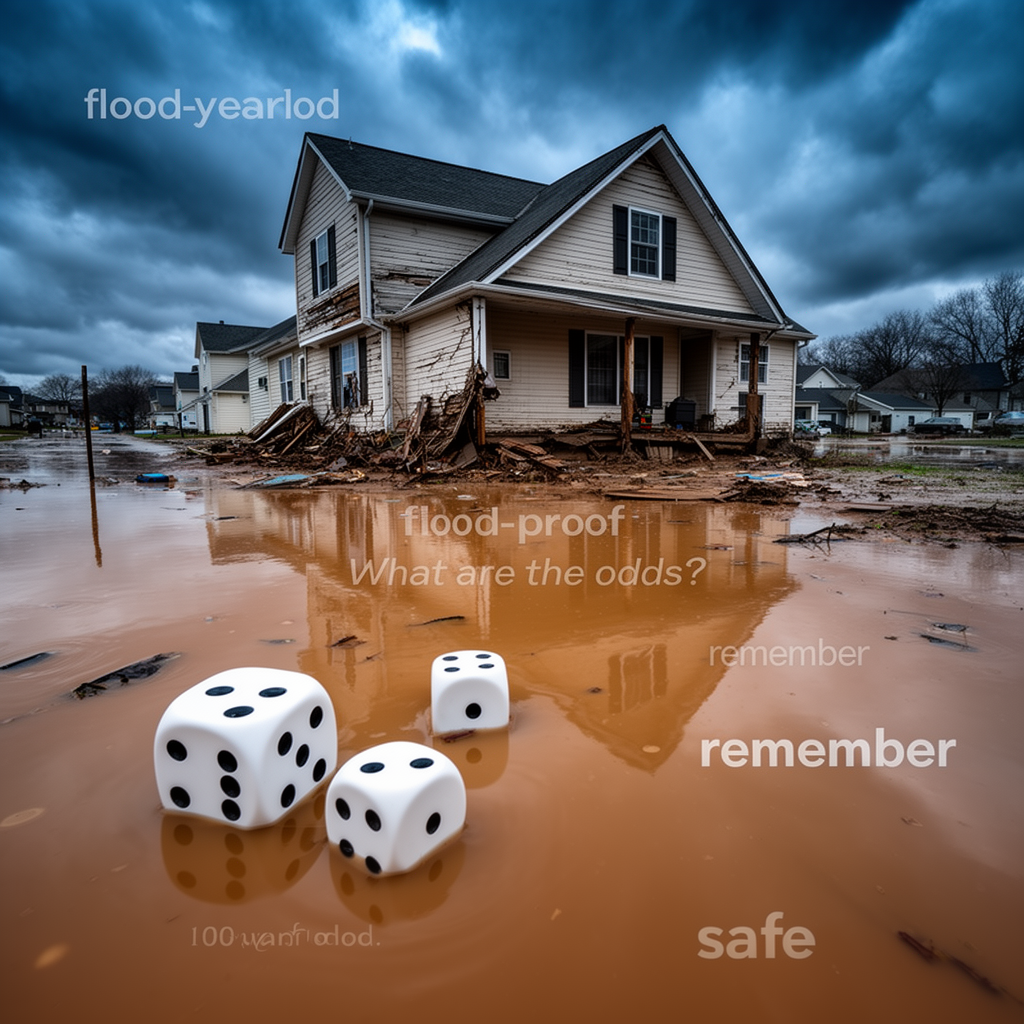
The phrase "100-year flood" creates a false sense of safety by implying floods operate on a predictable schedule. FEMA and USGS have tried to shift terminology to "1% annual chance flood," but the older label persists in engineering practice, insurance documents, and public communication.
This isn't malicious misinformation. It emerged from reasonable technical shorthand that, when translated by anyone who didn't take statistics in college, produces a completely wrong mental model. Nobody sat in a room deciding to mislead homebuyers, but the damage is done, the term has shaped where people build, how much insurance gets purchased, and how municipalities evaluate flood risk for generations.
If you own property for 30 years, the cumulative probability that you'll experience at least one 100-year flood during that period is approximately 26%. The calculation is straightforward: P = 1 - (1 - 0.01)^30, which equals roughly 26%, or about one in four. That's not a rare catastrophe, that's a coin flip over your homeownership lifetime.
For a 500-year flood event (0.2% annual probability), the 30-year cumulative probability is still about 5.8%. Even the most extreme regulatory flood zone thresholds carry meaningful lifetime risk for property owners. According to research on recurrence intervals, the cumulative probability over time is consistently underestimated by the public.
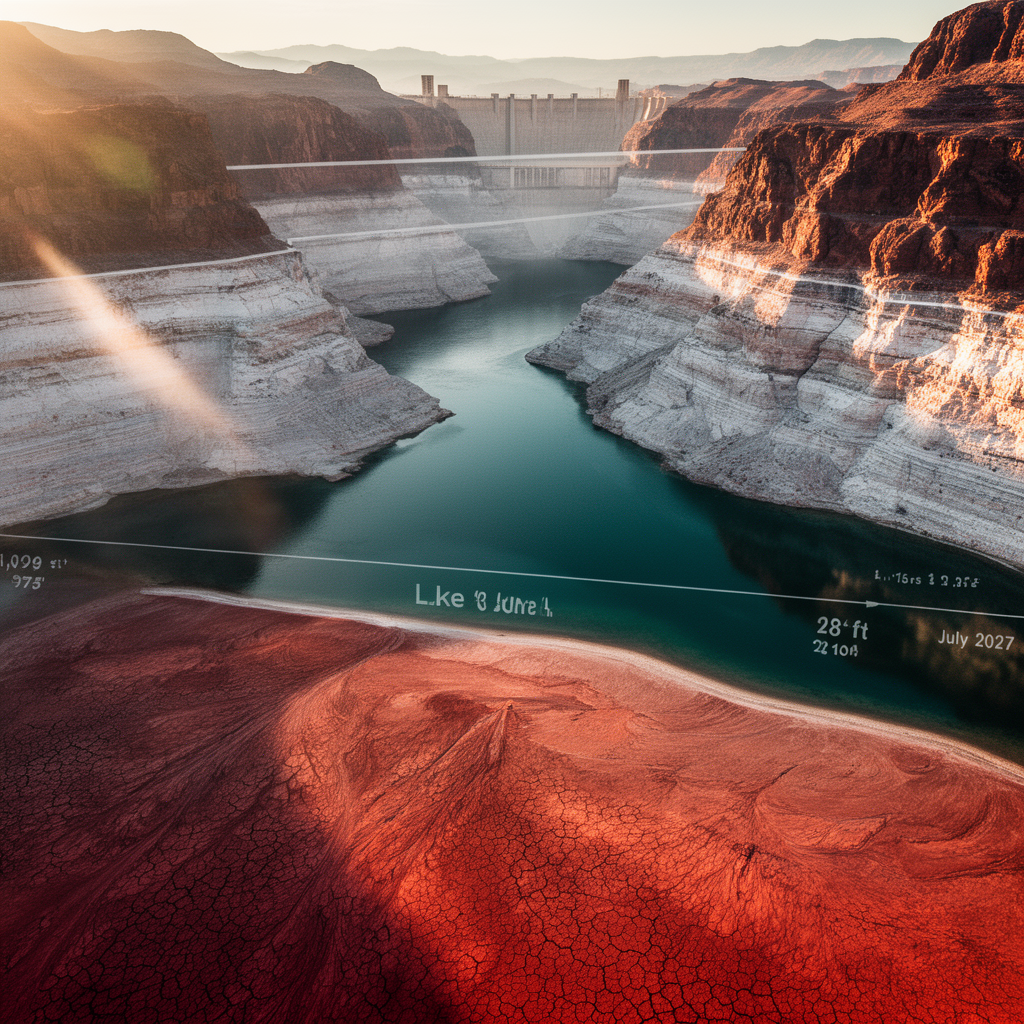
All of the above assumes historical rainfall records still accurately represent current and future precipitation patterns. They don't. The Clausius-Clapeyron relationship tells us the atmosphere holds approximately 7% more moisture for every degree Celsius of warming. Storms are intensifying.
IDF curves, the intensity-duration-frequency relationships that form the foundation of stormwater design across the United States, were developed from rainfall records that predate observable climate change impacts. Research on IDF curve modification under climate change shows that extreme precipitation is intensifying beyond historical baselines, particularly for short-duration, high-intensity events.
In Puerto Rico specifically, post-Maria analysis documented that the storm's rainfall totals exceeded the 1,000-year AEP threshold in multiple locations using pre-Maria IDF curves. The design storms that shaped existing drainage infrastructure were significant underestimates of what the current climate can deliver.
The term "100-year flood" is embedded in regulatory language, public communication, insurance frameworks, and engineering practice so deeply that replacing it would require coordinated overhaul of FEMA documentation, building codes, permit applications, and decades of professional habit. This isn't happening in your lifetime.
FEMA introduced "1% annual chance flood" in official guidance. It appears on flood insurance documents. It's routinely ignored by everyone, including many engineers who should know better, in favor of the more familiar and more misleading shorthand.
The practical answer is to stop using return periods as your primary risk communication tool and start using cumulative probabilities instead. When advising a client, developer, or municipality, the relevant question isn't "what is the return period?" It's: over the life of this structure, what is the probability this event will be equaled or exceeded?
A 50-year bridge designed for the 1% AEP event has a 40% chance of seeing that event exceeded during its design life. A 100-year building has a 63% chance. These numbers change conversations.
The flood risk associated with your location is almost certainly higher than the return period label suggests, for two simultaneous reasons: cumulative probability over time, and the fact that historical frequency curves may understate current storm intensities.
If you're evaluating property near water, understand that the 100-year floodplain designation is based on historical data that likely doesn't reflect current precipitation patterns. The risk you're actually accepting is higher than the maps suggest.
For infrastructure projects, presenting risk in terms of return periods to clients and decision-makers without also communicating cumulative lifetime probabilities is, at minimum, incomplete. The public deserves to understand what a 1% annual chance actually means over the duration of a mortgage or the design life of a project.
For planning and municipal officials, the appropriate question when evaluating development in flood-prone areas isn't whether a site is inside or outside the 100-year floodplain. It's: what is the total expected flood damage over the planning horizon, accounting for both annual probability and the changing climate baseline?
Design standards need updating. The IDF curves most commonly used in practice were calibrated on precipitation records that end before the most recent decade of observed intensification. Using these curves means designing for a climate that no longer fully exists.
The river doesn't negotiate. It doesn't honor budgets or building permits. It arrives with exactly the same 1% probability, year after year, patient as geology, indifferent to the label we've attached to it.
Q: If I experienced a 100-year flood last year, am I safe for the next 99 years?
A: No. The probability resets every year. You have the same 1% chance this year as you did last year, regardless of whether a flood occurred recently.
Q: Are flood maps and floodplain designations still accurate?
A: Many flood maps are based on outdated precipitation data and may underestimate current risk, especially in regions experiencing climate change impacts.
Q: What's the difference between AEP and recurrence interval?
A: They're mathematically related but conceptually different. AEP (annual exceedance probability) describes the yearly chance of an event. Recurrence interval is the inverse, often misinterpreted as a schedule.
Q: How does urbanization affect flood frequency?
A: Development increases impervious surfaces, accelerates runoff, and can turn what was historically a 100-year event into a more frequent occurrence without updating the flood maps.
Q: Should I buy flood insurance if I'm outside the 100-year floodplain?
A: Risk exists outside mapped floodplains. Consider cumulative probability over your ownership period and the potential for outdated flood maps when making insurance decisions.